How to Read Photometrics Reports
Posted on February 21, 2025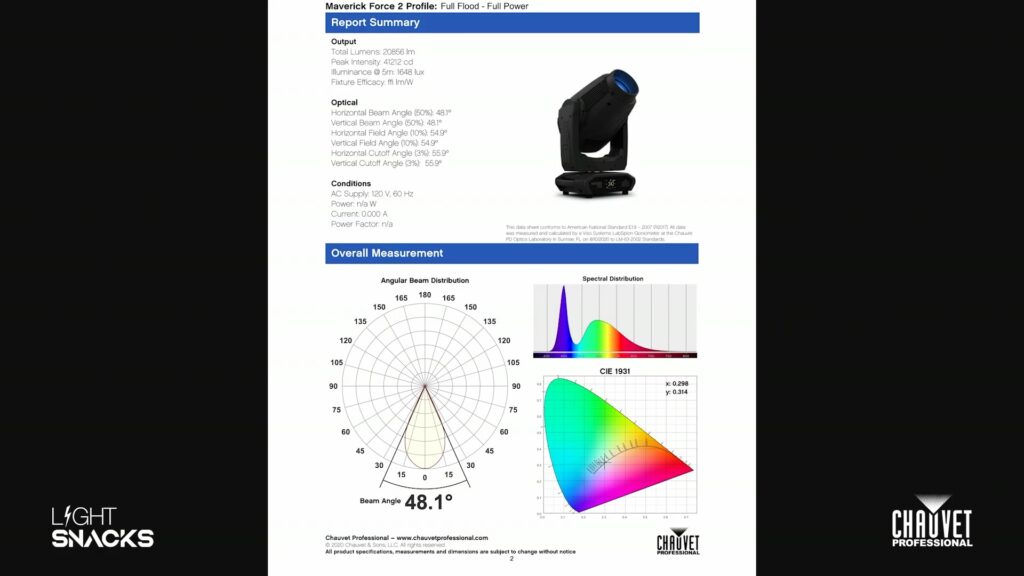
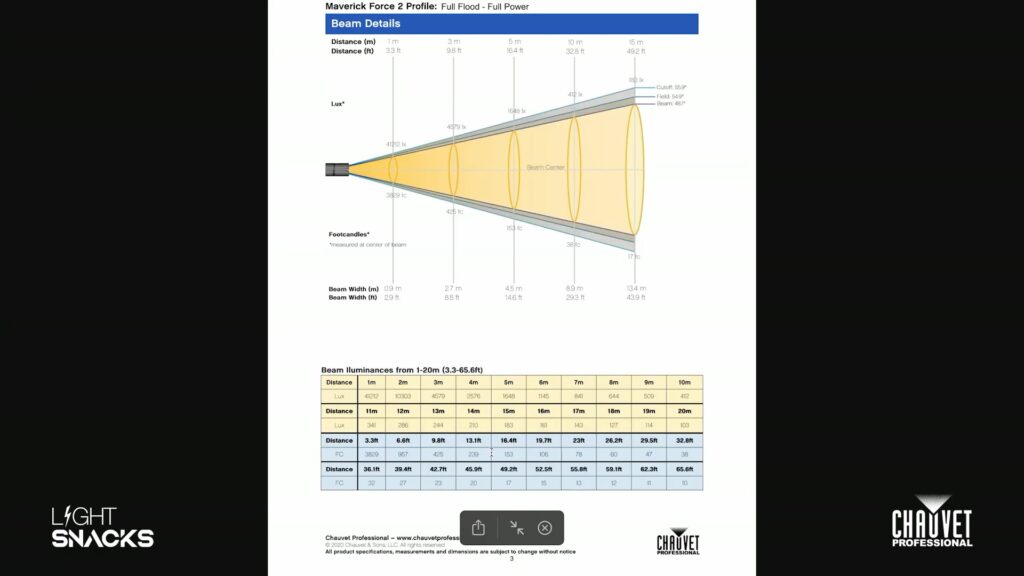
In this episode of Light Snacks, Senior Product Manager Mike Graham explains how to read and interpret photometrics reports, helping you make informed lighting design choices based on beam angles, peak intensity, zoom range, spectral distribution and more.
Key takeaways:
- Understanding total lumens and peak intensity
- How to interpret beam angle vs. field angle
- What spectral distribution means for color performance
- Using photometrics to predict real-world fixture performance
For a deeper dive into demystifying photometric readings from Lumens versus Lux to lighting measurement types and how to apply these metrics to various projects, click below to watch an in-depth Tech Talk panel discussion: